Visit DA

Client:
Visit DA
Tag:
Management – Reporting

The goal of this project was to provide a data management and visualization platform that can be used to monitor the health of equipment across many locations. Users may make informed decisions about storage allocation in light of the resulting data.

Visit DA
Challenges We Encounter

The client spoke mostly German, although English was the language most familiar to our staff.

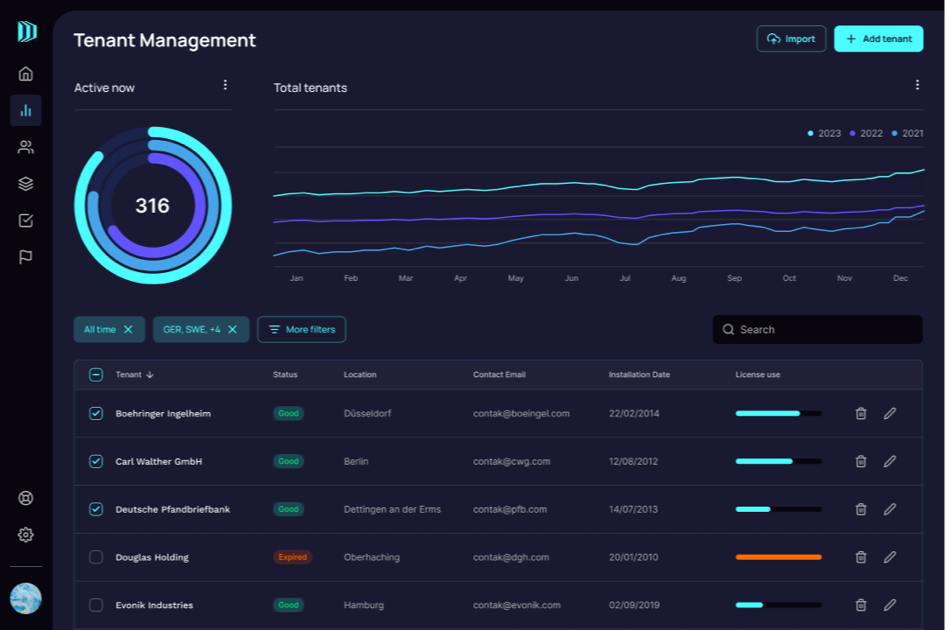
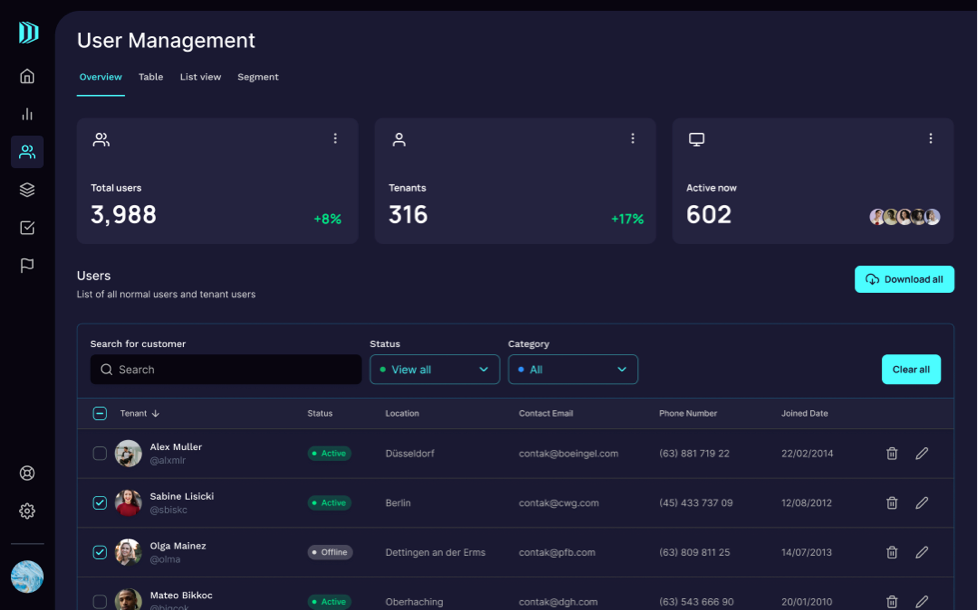
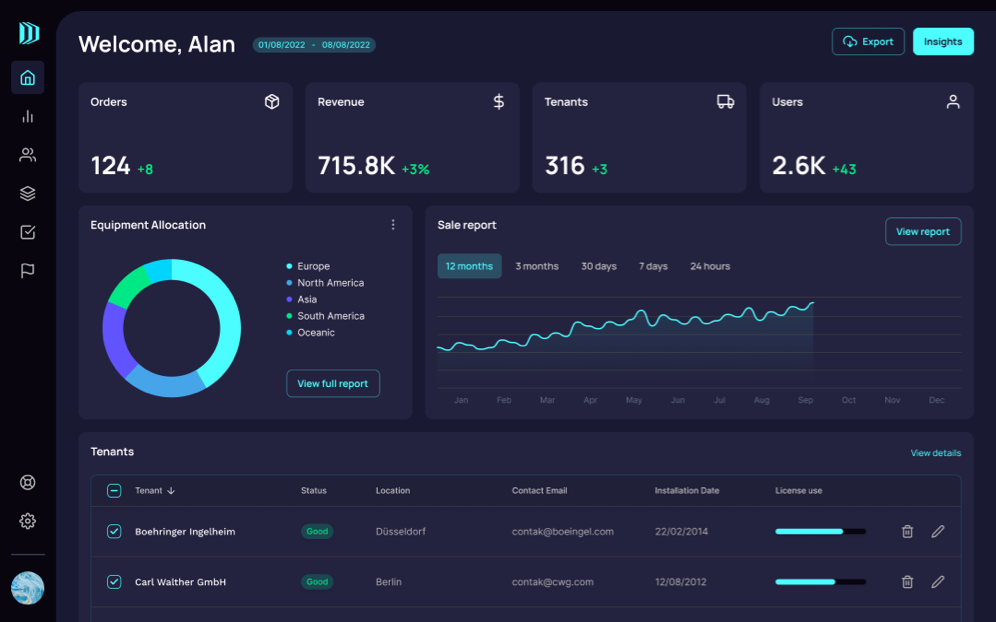
Complex computations across tables were an essential need for reports, necessitating in-depth familiarity with the preexisting database in order to extract and present data accurately.

The CanvasJS library could only do so much when it came to displaying charts, but sometimes more was needed.

Solutions

To get over the language barrier, the project team used translation software.

We worked closely with the client to understand the context of the data’s structure and content. In addition, we periodically provided the client with sample reports for verification purposes.

Code extensions to the chart that fully satisfy the specified need.

Features
Technologies

Specifically, the STS Software team utilized the following technologies for the project:

  • .NET core 3.1
  • Entity Framework
  • Bootstrap
  • jQuery
  • MSSQL
  • CanvasJS
  • Multi-Tenancy

Let’s Talk

Together with our developers and analysts, we begin by discussing and analysing our client’s needs, sketching the outline